Gold Price History: How Gold Has Performed Over Time
Gold’s price history is one of the most instructive narratives in finance. From a government-fixed price of $20.67 per ounce in the early 20th century to over $2,000 per ounce today, gold’s journey tells the story of inflation, currency debasement, geopolitical crises, and the enduring human desire for a reliable store of value. Understanding this history helps investors contextualize today’s gold prices and make informed decisions about gold’s role in their portfolios. This guide traces gold’s price from the Gold Standard era through Bretton Woods, the great bull market of the 1970s, the 20-year bear market, the 2000s resurgence, and the recent all-time highs. We examine the major events, policy decisions, and economic forces that drove each period — and what they tell us about gold’s future.
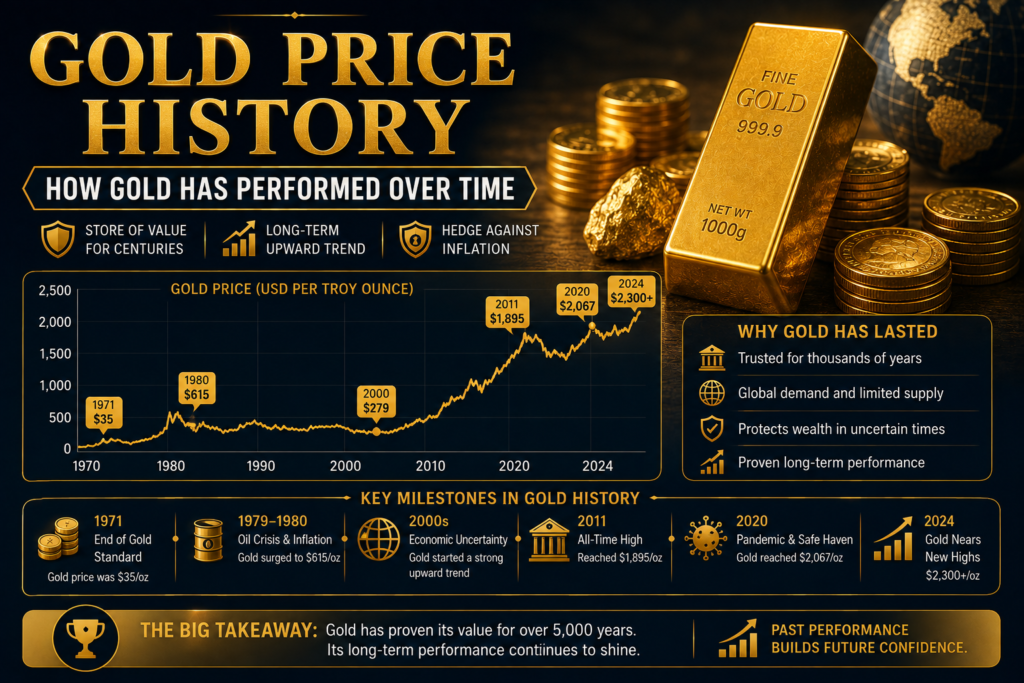
Gold Price History: Key Milestones • 1792–1933: Gold fixed at $19.39–$20.67/oz under the US Gold Standard • 1934–1971: Gold revalued to $35/oz under Bretton Woods system • 1971–1980: Free-floating gold soars from $35 to $850 (+2,329%) • 1980–2000: 20-year bear market; gold falls to $255 (-70%) • 2001–2011: Historic bull run; gold reaches $1,895 • 2011–2015: Correction to $1,050 (-44%) • 2016–2024: Recovery and new all-time highs above $2,000
1792–1933: The Gold Standard Era
For most of modern history, gold was money. Under the classical Gold Standard (1870s–1914), major economies pegged their currencies to gold at fixed rates. The US dollar was defined as 1/20.67 of an ounce of gold — a rate that remained essentially unchanged from 1792 until 1933. One British pound equalled £3/17s/10.5d per ounce. Currencies were freely convertible into gold, and international trade imbalances were settled in gold bullion. The Gold Standard provided remarkable long-term price stability. The US consumer price index in 1913 was roughly the same as it had been in 1800 — over a century with essentially no net inflation. However, the system was rigid. Countries could not expand their money supplies to stimulate economies during recessions. The Gold Standard was suspended during World War I and eventually collapsed during the Great Depression as countries abandoned gold convertibility to pursue expansionary monetary policies. In 1933, President Franklin D. Roosevelt issued Executive Order 6102, requiring US citizens to surrender their gold to the government at $20.67/oz. The following year, the Gold Reserve Act revalued gold to $35 per ounce — a 69% devaluation of the dollar against gold — where it would remain fixed for the next 37 years.
1944–1971: The Bretton Woods System
After World War II, the Bretton Woods agreement (1944) established a new international monetary system. The US dollar was pegged to gold at $35 per ounce, and other currencies were pegged to the dollar. Foreign governments could exchange their dollar reserves for physical gold from the US Treasury at the fixed rate. This made the dollar “as good as gold” and established it as the world’s reserve currency. The system worked for two decades, but by the 1960s, structural imbalances had emerged. US government spending on the Vietnam War and Great Society programs created large trade deficits and inflated the global dollar supply. Foreign governments — particularly France under Charles de Gaulle — began demanding gold in exchange for their dollars. US gold reserves dwindled from over 20,000 tonnes in the 1950s to approximately 8,000 tonnes by 1971. On August 15, 1971, President Richard Nixon “closed the gold window” — ending the dollar’s convertibility into gold. The Bretton Woods system collapsed. For the first time in modern history, no major currency was backed by gold. The era of pure fiat money had begun — and gold was about to embark on its greatest bull market.
1971–1980: The Great Gold Bull Market
Freed from its $35 price ceiling, gold entered a historic bull market. From 1971 to its peak in January 1980, gold rose from $35 to $850 per ounce — a gain of 2,329% in less than a decade. This remains one of the greatest asset price surges in financial history. Several forces combined to drive this extraordinary performance. The US experienced its worst peacetime inflation, with CPI reaching 14.8% in 1980. The Iranian Revolution (1979) and Soviet invasion of Afghanistan (1979) created geopolitical crisis demand. Oil prices surged from $3 to $40 per barrel. The dollar weakened dramatically. And perhaps most importantly, gold was “catching up” from decades of artificial price suppression — $35/oz had significantly undervalued gold relative to the inflation that had occurred since 1934. Gold’s peak of $850 in January 1980, adjusted for inflation, equates to approximately $3,200 in today’s dollars — a level gold has not yet sustainably reached in real (inflation-adjusted) terms. This remains the inflation-adjusted all-time high.
| Year |
Gold Price (Year-End) |
Key Event |
| 1971 |
$43.50 |
Nixon ends gold convertibility (Aug 15) |
| 1973 |
$106.50 |
Oil crisis; US inflation reaches 8.8% |
| 1974 |
$183.85 |
US citizens allowed to own gold again (Dec 31) |
| 1979 |
$524.00 |
Iranian Revolution; oil crisis; inflation at 13.3% |
| 1980 (Jan 21) |
$850.00 |
All-time high (nominal); Soviet invasion of Afghanistan |
1980–2000: The 20-Year Bear Market
After its spectacular rise, gold entered a prolonged bear market that lasted two decades. From its 1980 peak, gold steadily declined, reaching a low of approximately $255 per ounce in 1999-2001 — a 70% decline from the peak. Adjusted for inflation, the decline was even more severe: gold’s purchasing power fell by over 80%. Several factors drove this extended decline. Federal Reserve Chairman Paul Volcker raised interest rates to nearly 20% in 1981, crushing inflation — and gold’s primary demand driver. The US entered a period of strong economic growth, low inflation, and a strong dollar — the “Great Moderation.” Stocks entered a historic bull market (1982-2000), making non-yielding gold unattractive by comparison. Central banks, including the Bank of England, sold significant portions of their gold reserves, adding supply pressure to the market. Gold became so unfashionable as an investment that by 1999, the British Chancellor of the Exchequer, Gordon Brown, announced the sale of 400 tonnes of UK gold reserves at prices near $275/oz — a decision later known as “Brown’s Bottom” that marked the exact trough of the 20-year bear market.
| Year |
Gold Price (Year-End) |
Key Event |
| 1980 |
$589.50 |
Volcker raises rates to 20%; gold crashes from $850 |
| 1985 |
$327.00 |
Plaza Accord; dollar weakens but gold unmoved |
| 1990 |
$391.00 |
Gulf War; brief spike then continued decline |
| 1999 |
$290.25 |
UK Gold Sales (“Brown’s Bottom”); Washington Agreement on Gold |
| 2000 |
$272.65 |
Dot-com crash; gold begins its recovery |
2001–2011: The Modern Gold Bull Market
Gold’s resurgence in the 2000s was driven by a confluence of factors that created near-perfect conditions for a precious metals bull market. The dot-com crash and 9/11 attacks ushered in an era of low interest rates, expansionary monetary policy, and geopolitical uncertainty. The Federal Reserve cut rates to 1% and held them there, creating negative real interest rates. The US dollar entered a multi-year decline. The Iraq and Afghanistan wars generated fiscal deficits and safe-haven demand. And the rise of China and India created unprecedented physical gold demand from the world’s two most populous nations. The 2008 global financial crisis accelerated all these trends. Central banks responded with unprecedented monetary stimulus — zero interest rates, quantitative easing, and massive liquidity injections. Fears of currency debasement and inflation drove investors into gold. From its 2001 low of $255 to its 2011 peak of $1,895 per ounce, gold gained 643% — an annualized return of approximately 22%.
| Year |
Gold Price (Year-End) |
Key Event |
| 2001 |
$278.50 |
9/11 attacks; recession begins; rate cuts accelerate |
| 2005 |
$517.10 |
Gold ETF (GLD) launched; investor access expanded |
| 2008 |
$884.30 |
Global financial crisis; Lehman collapse; TARP bailout |
| 2011 |
$1,531.00 |
US debt downgrade; Eurozone crisis; peak at $1,895 (Sep) |
2011–2015: The Post-Peak Correction
After reaching $1,895 in September 2011, gold entered a significant correction. By December 2015, gold had fallen to $1,050 per ounce — a decline of 44% from the peak. Several factors drove this correction: the US economy was recovering, the Federal Reserve signalled it would taper quantitative easing and eventually raise rates, the dollar strengthened, and inflation remained subdued. The “taper tantrum” of 2013, when the Fed first mentioned reducing bond purchases, triggered a particularly sharp gold sell-off. This period demonstrated gold’s sensitivity to real interest rate expectations. When markets began pricing in higher rates, gold’s lack of yield became a significant disadvantage relative to bonds. The correction was a stark reminder that gold is not a one-way trade and that buying near cyclical peaks can result in years of negative returns.
2020–2024: Record Highs and New Territory
The COVID-19 pandemic triggered an extraordinary policy response that created ideal conditions for gold. Central banks cut rates to zero, governments launched multi-trillion-dollar stimulus programs, and money supply expanded at unprecedented rates. In August 2020, gold reached a new all-time nominal high of $2,067 per ounce. After a consolidation period in 2021-2023 (during which the Fed’s aggressive rate hikes created headwinds), gold surged to new records in 2024, driven by a combination of central bank buying at historic levels, expectations of Fed rate cuts, geopolitical tensions (Russia-Ukraine, Middle East), and continued strong physical demand from Asia. Central bank purchases exceeded 1,000 tonnes for two consecutive years — more than double the pre-2022 average.
Long-Term Gold Performance: The Numbers
| Period |
Start Price |
End Price |
Total Return |
Annualized |
| 1971–1980 |
$35 |
$589 |
+1,583% |
+36.8% |
| 1980–2000 |
$589 |
$273 |
-53.7% |
-3.8% |
| 2000–2010 |
$273 |
$1,421 |
+421% |
+17.9% |
| 2010–2020 |
$1,421 |
$1,887 |
+32.8% |
+2.9% |
| 20-Year (2004–2024) |
$409 |
$2,350 |
+474% |
+9.1% |
| 50-Year (1974–2024) |
$183 |
$2,350 |
+1,184% |
+5.3% |
What Gold’s History Teaches Investors
1. Gold Protects Against Currency Debasement — Over the Long Run
The single most powerful lesson from gold’s history is its ability to preserve purchasing power across decades and generations. Since 1971, the US dollar has lost over 85% of its purchasing power relative to gold. An ounce of gold bought a high-quality men’s suit in 1971 ($35) — and it still does today ($2,000+). This preservation of purchasing power is gold’s most valuable investment characteristic.
2. Gold’s Performance Is Cyclical — Not Linear
Gold does not rise steadily. It experiences dramatic bull markets (1971-1980, 2001-2011) followed by extended bear markets (1980-2000, 2011-2015). Investors who buy at cyclical peaks and sell during corrections can experience negative returns for years or even decades. Gold requires patience and a long time horizon — ideally 10+ years — to reliably deliver positive returns.
3. Real Interest Rates Are Gold’s Most Important Driver
Time and again, gold’s price movements correlate most strongly with real interest rates (nominal rates minus inflation). When real rates are negative — inflation exceeds interest rates — gold tends to perform strongly (1970s, 2000s, 2020). When real rates are positive and rising, gold struggles (1980s, 2013-2015). This relationship is more reliable than any other single indicator.
4. Central Banks Are the Ultimate Smart Money
Central banks were net sellers of gold during the 1990s — near the bottom. They became net buyers in 2010 and have increased purchases to record levels in the 2020s — near all-time highs. While central banks are not always perfectly timed, their collective behavior provides an important signal about gold’s role in the international monetary system.
Frequently Asked Questions About Gold Price History
What is the highest gold price in history?
The all-time nominal high for gold varies with current market conditions. The 2020 record was $2,067/oz. In inflation-adjusted terms, January 1980’s $850/oz peak equals approximately $3,200 in today’s dollars — making it the real all-time high. Use our historical gold value calculator to compare any date.
Has gold ever gone down in value?
Yes, significantly. Gold fell 70% from 1980 to 2000 ($850 to $255). It fell 44% from 2011 to 2015 ($1,895 to $1,050). Gold is a long-term store of value, not a guaranteed short-term profit vehicle. It has delivered positive returns over every 15-year rolling period since 1971, but shorter periods can show significant losses.
How much has gold returned over the long term?
Over 50 years (1974-2024), gold has returned approximately 5.3% annualized. Over 20 years (2004-2024), approximately 9.1% annualized. These returns are in line with or slightly below long-term stock market returns, with the important difference that gold’s returns have been largely uncorrelated with stocks — providing true diversification.
Why was gold so cheap in the 1990s?
The 1990s represented a “perfect storm” against gold: strong economic growth, low inflation, a strong US dollar, rising real interest rates, a historic stock market bull run, and central bank gold sales. With inflation seemingly defeated and stocks delivering 20%+ annual returns, investors saw no need for gold. This environment proved temporary.
Will gold reach new all-time highs?
No one can predict future gold prices with certainty. However, the structural factors supporting gold — central bank buying, geopolitical uncertainty, fiscal deficits, and the long-term trajectory of fiat currency purchasing power — suggest that new nominal highs are likely over time. Whether gold reaches new inflation-adjusted highs (~$3,200 in today’s dollars) depends on the severity of future inflation and currency depreciation.